The positions of probes P1 and P2 were different for each piano, and the same for each note (frequency). Probes A & B varied positions for each frequency on each piano. Probes A & B were moved to the sections of most movement on each soundboard, for each note.So probes P1 & P2 compared the effect of the vibration at a particular position for different notes, and probes A& B measured the most soundboard movement per note. It was expected that each soundboard would vibrate differently because of the difference in string material, string coupling, and because each soundboard is different in width, length, thickness and wood type, see table 3.4, above.
Soundboard Frequency Maps
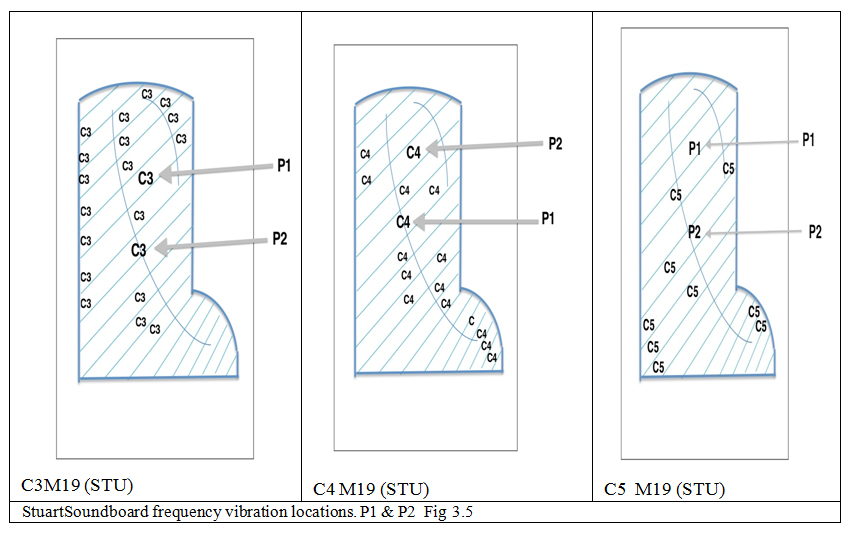
Central positions were decided on after plotting frequency maps for C3, C4, and C5, by touching lightly the boards from under the pianos whilst the note was sounded.
Similar to the vibrations in a piano string, the vibrations in the soundboard are classified by their modes of vibration, which are identified by the frequency at which they vibrate (Hz). As with the vibrations in a stretched string, the lower frequency produces a slower, larger vibration, and as the frequency rises the vibration is smaller and faster. The diagrams below (fig 3.5, 3.6) taken from two research investigations, illustrate the vibrational modes of several modern 9ft grand pianos, with an approximate soundboard thickness of 9-10mm, tapering off to the edges. Both diagrams illustrate the size of the vibrations relative to their frequency mode, and shows that as the frequency Hz rises, vibrations reduce in size and occur in many areas of the soundboard.
StuartP1 & P2 positions of the soundboard frequency map of vibrations, for C3, C4, C5: