C2 MW box graph example.
The SPL values of one note C2, struck at three velocities, recorded in the MW space by 8 microphones, comprised a total of 24 recorded values of SPL for each piano. To summarise the range of these values, the 24 values are categorised into four SPL range groups of 6 notes each, from the quietest notes, range (r1) to the loudest notes, range (r4). Characteristics of each piano’s SPL are informed by comparing both the ranges of each 25% segment (r1-r4) and the total SPL range.
C2MW Boxgraph
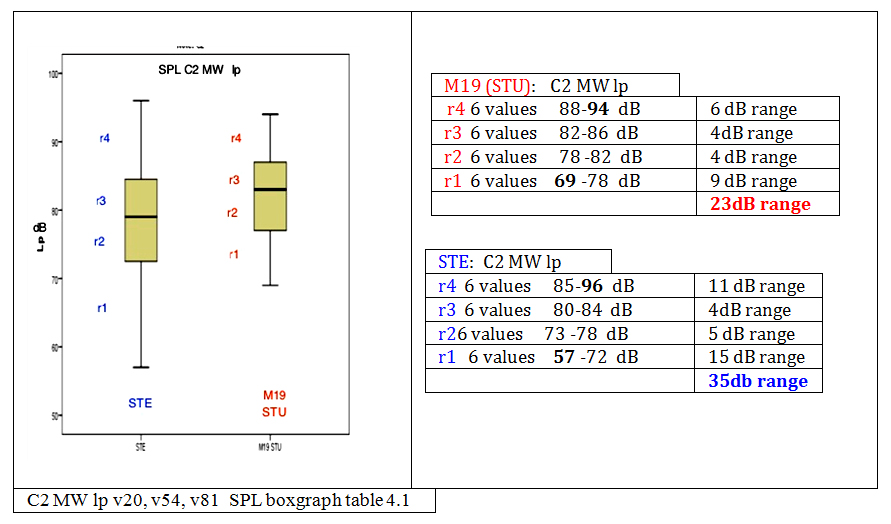
A higher proportion of the Stuart notes were sounded in higher dB ranges than Steinway, revealing that the Stuart produced more louder notes than the Steinway. The Steinway sounded a wider range by 13dB, with the loudest and the softest notes of C2. This could also mean that the Stuart was outputting more consistently accurate volumes per calibrated velocity strike. The fact that the r1 range of the Stuart is significantly louder than the r1 range of the Steinway suggests that the Stuart is capable of producing softer sounds than the Steinway. To test this,the striker could be set to strike the key at the slower velocities ofv10, and v5.
The piano sounds recorded in the MW space are initially presented in the following pages as an introductory summary of the range of tonal characteristics found in the four notes, struck at 3 velocities. In Chapter 4 sounds are presented in categorised groupings of tonal characteristic:
- Fundamental partial – slower decay
- Earlier transition into the after-sound oscillation phase.
- Wider harmonic spectrum
- Directivity of the maximum SPL radiations
- Projections to 6 metres, mic 8