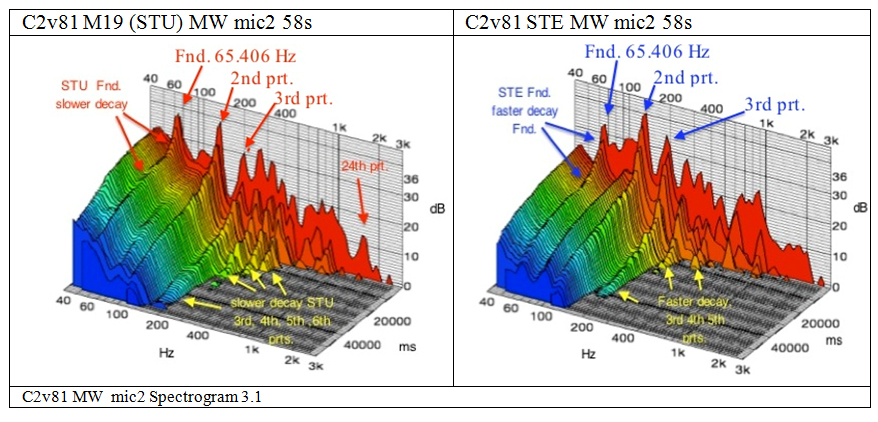
The dynamic transients of loudness (dB), are measured by the vertical axis, and the frequency (Hz) by the horizontal axis. The 3rd axis is a measure of time, milli seconds (ms). This 3rd axis provides a view of the transient nature of the sound as it decays from the rear of the graph to the front. Spectrogram 3.1 plots the sound for a duration of 58s or 58,000 ms. , and shows that the Stuart sound decayed at a slower rate than the Steinway in the fundamental frequency (Fnd.), and the 3rd,, 4th&5thpartial frequencies (prt.).
The decay rate dB/ms of thecomposite tone of the both piano sounds is analysed in decay graphs throughout this research. Decay Graph 3.1 below exhibits three plotted states of decay for each of the sounds. i) onset ; ii) unsettled after-sound; iii) settled after-sound. This decay graph shows that the Stuart sound (red) has decayed at a slightly faster rate than Steinway(blue) in the onset state of .5s, and at a slower rate than Steinway in both the after-sound states. The significant difference in the sounds occurs in the 3s unsettled after-sound state between 2.2s- 5.2s. The Stuart sound appears to have arrived into its settled after-sound oscillation earlier than Steinway.
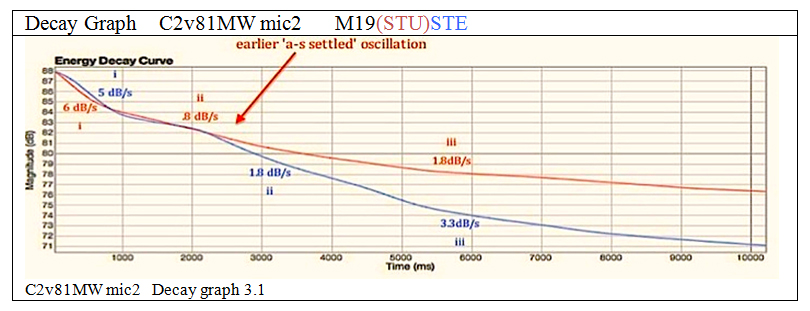
The earlier establishment of the settled oscillation state in the Stuart sound in the sound above, is a characteristic observed in many of the Stuart sounds, and is one of the four characteristics listed on page one of this chapter.